Intro to Data
Click here to open the slides (PDF).
R code created during meeting.
data(mtcars)
library(tidyverse)
## ── Attaching packages ─────────────────────────────────────── tidyverse 1.3.1 ──## ✓ ggplot2 3.3.5 ✓ purrr 0.3.4
## ✓ tibble 3.1.6 ✓ dplyr 1.0.7
## ✓ tidyr 1.1.4 ✓ stringr 1.4.0
## ✓ readr 2.1.0 ✓ forcats 0.5.1## ── Conflicts ────────────────────────────────────────── tidyverse_conflicts() ──
## x dplyr::filter() masks stats::filter()
## x dplyr::lag() masks stats::lag()cor.test(mtcars$wt, mtcars$mpg)##
## Pearson's product-moment correlation
##
## data: mtcars$wt and mtcars$mpg
## t = -9.559, df = 30, p-value = 1.294e-10
## alternative hypothesis: true correlation is not equal to 0
## 95 percent confidence interval:
## -0.9338264 -0.7440872
## sample estimates:
## cor
## -0.8676594ggplot(mtcars, aes(x = wt, y = mpg)) +
geom_point() +
geom_smooth(method = 'lm')## `geom_smooth()` using formula 'y ~ x'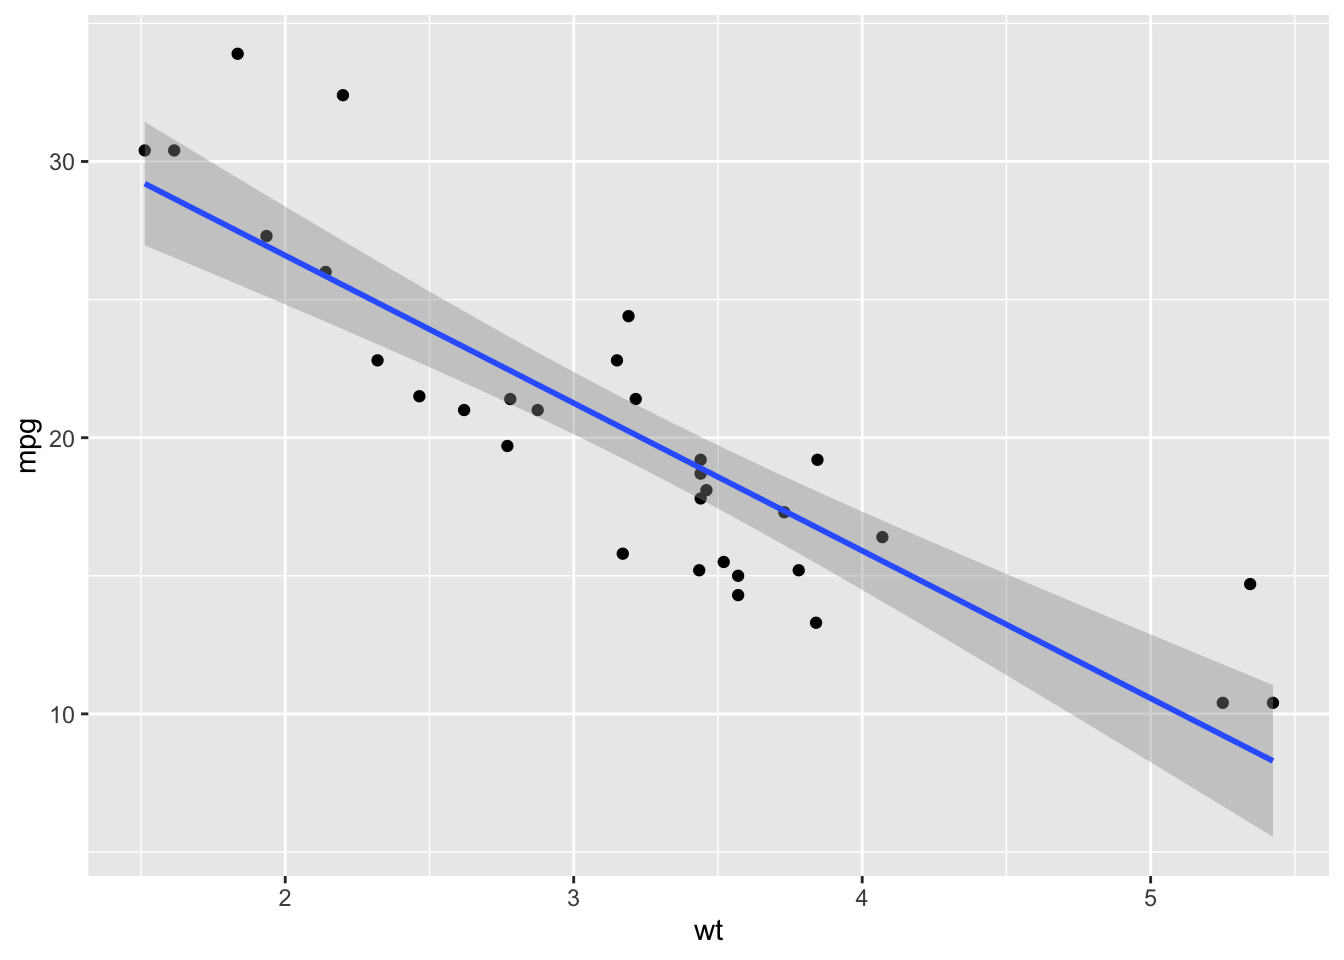
lm.out <- lm(mpg ~ wt + hp, data = mtcars)
summary(lm.out)
##
## Call:
## lm(formula = mpg ~ wt + hp, data = mtcars)
##
## Residuals:
## Min 1Q Median 3Q Max
## -3.941 -1.600 -0.182 1.050 5.854
##
## Coefficients:
## Estimate Std. Error t value Pr(>|t|)
## (Intercept) 37.22727 1.59879 23.285 < 2e-16 ***
## wt -3.87783 0.63273 -6.129 1.12e-06 ***
## hp -0.03177 0.00903 -3.519 0.00145 **
## ---
## Signif. codes: 0 '***' 0.001 '**' 0.01 '*' 0.05 '.' 0.1 ' ' 1
##
## Residual standard error: 2.593 on 29 degrees of freedom
## Multiple R-squared: 0.8268, Adjusted R-squared: 0.8148
## F-statistic: 69.21 on 2 and 29 DF, p-value: 9.109e-12